Shandong Fengtu IOT Technology Co., Ltd
Sales Manager:Ms. Emily Wang
Cel,Whatsapp,Wechat:+86 15898932201
Email:info@fengtutec.com
Add:No. 155 Optoelectronic Industry Accelerator, Gaoxin District, Weifang, Shandong, China


Sales Manager:Ms. Emily Wang
Cel,Whatsapp,Wechat:+86 15898932201
Email:info@fengtutec.com
Add:No. 155 Optoelectronic Industry Accelerator, Gaoxin District, Weifang, Shandong, China
Model:FT-NQ10
Brand:fengtu
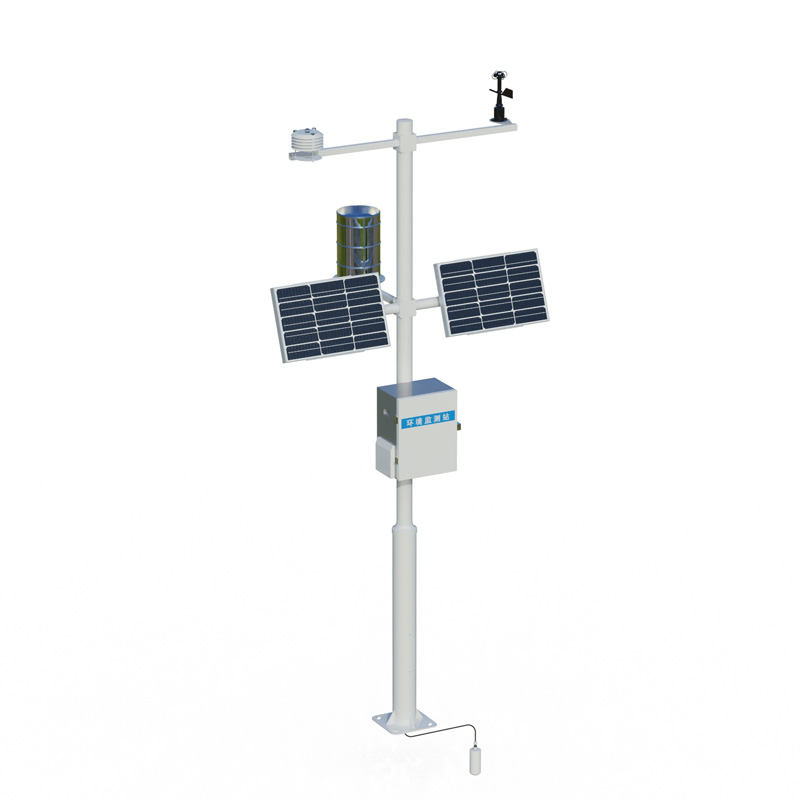
1.Introduction to Automatic Farmland Weather Station
NQ10 Automatic Farmland Weather Station is a highly integrated, low-power, fast installation and easy for field monitoring.
The device consists of five parts: meteorological sensor, collector, solar power supply system, pole support, and cloud platform.It is free of debugging and can be quickly arranged, and is widely used in meteorological, agriculture, forestry, scientific investigation and other fields.
2.Product features of Automatic Farmland Weather Station
1.Low-power collector: static power consumption is less than 50uA
2.Standard GPRS networking, support extended Bluetooth, and wired transmission
3.Seven-inch Android touch screen, version: 4.4.2, quad-core Cortex™-A7, 512M/4G
4.Support modbus485 sensor expansion
5.Solar Charging Management MPPT Automatic Power Point Tracking
6.Three-meter carbon steel bracket, two threaded screw connection
7.Send SMS alarm, send SMS to the specified mobile phone after exceeding the limit
8.Stainless steel material protective box, corrosion-resistant and oxidative-resistant, waterproof grade IP66
3.Technical parameters of Automatic Farmland Weather Station
1.Collector power supply interface: GX-12-3P plug, input voltage 5V, with RS232 output Json data format, collector power supply: DC5V±0.5V peak current 1A,
2.Sensor modbus, 485 interface: GX-12-4P plug, output power supply voltage 12V/1A, device configuration interface: GX-12-4P plug, input voltage 5V
3.Solar power supply and equipped with lead-acid battery, optional 30W 20AH/50W 20AH/100W 100AH.Charging controller: 150W, MPPT automatic power point tracking, efficiency is increased by 20%.
4.Data upload interval: 1 minute-1000 minutes adjustable
5.Screen size: 1024*600 RGB LCD
6.Some sensor parameters
| name | Measurement range | Resolution | Accuracy |
| Ambient temperature | -40~+80℃ | 0.01℃ | ±0.3℃ (25℃) |
| Relative humidity | 0~100%RH | 0.01%RH | ±3%RH (20%~80%) |
| Light intensity | 0-157286LUX | 1Lux | <±3% |
| Atmospheric pressure | 300-1100hpa | 0.1hPa | ±0.25% |
| Dew point temperature | 0~+70℃ | 0.1℃ | ±1℃ |
| Tube soil temperature | -30~+70℃ | 0.01℃ | ±0.3 (-10~70℃) |
| Tube soil moisture | 0~100% | 0.1% | ±3% |
| Tube Soil Salt | 0~20000us/cm | 1us/cm | ±3 (0~10000us/cm) ±5% (full range) |
| Soil PH (electrode method) | 0-14PH | 0.01 | ±0.1PH |
| Soil nitrogen, phosphorus and potassium | 0~1999mg/kg | 1mg/kg | ±2% |
| Soil evaporation | 0~75mm | 0.1mm | ±1% |
| wind direction | 0~360° (8 directions) | 1/8 | <3°(>1.0m/s) |
| Wind speed | 0~30m/s | 0.1m/s | ±(0.2+0.03V) m/s (25℃, V indicates wind speed) |
| rainfall | ≦4mm/min | 0.2mm | ≤±2% |
| Ultraviolet radiation | 0~500W/㎡ | 0.01W/㎡ | ≤±3% |
| Sunshine hours | 0~6500h | 0.1h | <0.2h |
| Total photoelectric radiation | 0-2000W/m2 | 1W/m2 | <±3% |
| Photosynthetic effective radiation | 0-2000W/m2 | 1W/m2 | ≤±5% |
| carbon dioxide | 400-5000ppM | 1ppM | ±(50ppm+5% reading |
| PM2.5 | 0-1000ug/m³ | 1ug/m³ | ±10% (<500 micrograms) |
| PM10 | 0-1000ug/m³ | 1ug/m³ | ±10% (<500 micrograms) |
| Carbon monoxide | 0-1000ppm | 1PPM | ±2PPM |
| Sulfur dioxide | 0-20PPM | 0.1PPM | ±1PPM |
| Nitrogen dioxide | 0-20PPM | 0.1PPM | ±1PPM |
| ozone | 0-20PPM | 0.1PPM | ±1PPM |
| Negative oxygen ions | 0~100,000 units/cm3 | 1/cm3 | Reading ±10%; ion mobility ≤±20% |
| Oxygen content | 0~25%Vol | 0.1% | ±3%FS |
4.Automatic Farmland Weather Station Cloud Platform
1.CS architecture software platform, supports direct observation of mobile phones and PC browsers without additional software installation.
2.Support multiple accounts and multiple devices to log in
3.Support real-time data display and historical data display dashboard
4.Cloud server and cloud data storage are stable and reliable, easy to scale, and load balancing.
5.Support SMS alarm and threshold settings
6.Support map display and viewing device information.
7.Support data curve analysis
8.Support data export table form
9.Supports data forwarding, HJ-212 protocol, TCP forwarding, http protocol, etc.
10.Support data post-processing function
11.Support external running of javascript scripts
Waterway visibility detection is a crucial aspect of ensuring water transportation safety. On river waterways, especially in mountainous river sections, abundant water vapor conditions easily form heavy fog, posing serious threats to ship navigation. During poor visibility conditions, ports are ofte...
The high-altitude monitoring lamp is specifically designed for tracking high-altitude migratory pests, such as the Fall Armyworm (*Spodoptera frugiperda*). By leveraging the pests' phototactic behavior—their natural attraction to light—the device lures migratory insects flying at altitud...
Emergency meteorological monitoring refers to the rapid and accurate monitoring and analysis of relevant meteorological parameters during sudden meteorological disasters or emergency events. Its purpose is to provide timely and reliable meteorological evidence for emergency decision-making, so as to...
On the stage of nature, agriculture and meteorology are an inseparable pair of dancing partners. The growth, development, yield, and quality of agricultural crops are all directly affected by the weather. Temperature, light, and moisture, these three meteorological elements, constitute the cornersto...


 Get a Free Quote
 Skype
Skype
 whatsapp
 mail
mail